August 7th, 2014
The Guide to Painlessly Tracking Your Results with Google Analytics
How much time do you spend monitoring your results?
Do you know how many people subscribe to your mailing list from Facebook?
Do you know how many of those subscribers turn into customers?
How many people visited your sales page during the last launch vs. how many actually completed a sale?
Claire Pelletreau is back on the blog today to to share what she knows about tracking results during a launch. Her work creating and managing Facebook Ad campaigns depends on it!
Don’t forget to grab the download of this post as a pdf at the bottom!
This blog post is for everyone who’s been too afraid, too confused or (here comes the truth!) too lazy to dig into their business’s data. If you don’t want to do it every month, I completely respect that.
I used to spend most of my day up to my eyeballs in LKR Social Media’s data, and I found it was fascinating to see what was going on behind the scenes!
I also knew, however, that not many people geek out about this stuff.
I figured I’d always be a data junkie.
But now that I’m running my own one-woman show, I’ve completely thrown away some of my data-driven best practices.
Confession time: I’ve barely got the basics set up!
Why? Because when you’ve got so much to do every single day, and your to-do list has no end in sight, the last thing you want to spend your time on is minutia like UTM parameters! (Don’t ask.)
But there are a few things that I’m not going to let you skip over, kind reader and fellow entrepreneur.
And here’s why: I’m going to assume one of the reasons you’re in business is to make money.
And you’d probably like to make more.
And I bet you’d happily buy me a drink if I could show you legitimate ways to make more money without changing very much in your business.
The bad news is that it’s pretty unlikely we live close enough to go grab that drink (and that really is bad news – I bet it’d be really fun).
The very fabulous news is that you can actually figure out what you need to do to bring in more revenue by using a free tool: Google Analytics.
Wait!
Before you go clean up the kitchen because frankly you’d rather do anything other than fumble around in Google Analytics, stick with me for a second.
Here are the very basics of what you need to set up so that you can track the important metrics of your next launch.
Before The Launch: Get Google Analytics In Shape
In just a second I’m going to give you my top five things you need in place in order to track your results effectively. But before you even make a move towards opening the cart on your next launch, make sure you have the first two up and running.
You will thank me later for this, I promise!
During The Launch: Top Five Tracking Must-Haves
1. Get Google Analytics on every page.
Not sure how? Use the WordPress plugin Google Analyticator, and you’re set! If you have a designer creating a special sales page or other static page on your website, make sure you ask her to add your Google Analytics code between the <head> tags.
Most platforms have a simple place to add your Google Analytics code, so if you have GA set up, look for where to install it on your website platform.
2. Set up goals in Google Analytics.
Goals allow you to track what happens when someone visits your site.
Goals aren’t difficult to set up – click here for instructions – but they can tell you SO much about what worked well in your launch.
There are two principal goals that you should be tracking during a launch:
- Free content goals: These goals track every time someone signs up for your webinar, free sample, hangout, free challenge or any other free content you’re giving away in the run up to your launch.
- Purchase goals: These goals track when someone purchases your product. In order to track this goal, you need to have a “thank you” page that I see after my purchase is completed. Make sure that if you send me to a different site in order to make my payment (like PayPal) that you set it up to redirect me back to a specific url on your site.
3. Place conversion tracking code for any paid advertising like Facebook, Twitter, and soon to be Pinterest!
Conversion tracking code is provided by every place you are running ads. Facebook calls it a conversion pixel. Twitter calls it a snippet. Even though you have your goals set up in Google Analytics, you absolutely need to get a clear ROI on any paid advertising you’re running.
Don’t skip this step – it will tell you exactly how much money you make off of each conversion.
4. Create trackable links in your promo emails, part one.
Your email provider should provide this very handy service, but make sure you’ve got the correct box checked. When you have link tracking set up, all the traffic that comes to your sales page from your promo emails will show up in Google Analytics.
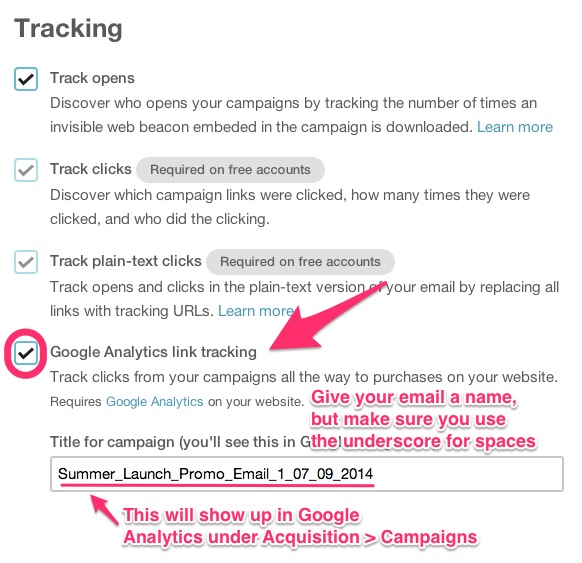
5. Add trackable links in your promo emails, part two.
Anne talks about a little trick she uses to get in touch with people who aren’t buying her product in this episode. She found a great way to find out what people’s objections to buying are so that you can address them in your own marketing.
Anne was able to identify who had clicked on a link to her sales page during the launch but who hadn’t bought by setting up some fancy tracking within her email provider.
Now this process is going to be different with each email provider but it’s absolutely worth a little searching within their documentation.
At a complete loss? Do a search on Upwork for a [name of your email provider] expert, and hire them for a couple hours to help you figure this out once and for all. Get them to document how it’s done so you have it in writing for next time.
Post-Launch: What Data Should You Look At and How Often Should You Look At It
You don’t really need to look at any of this data once your launch in progress.
You have enough on your plate, right?
Leave digging into Google Analytics for once the dust has settled a bit.
The exception is if you’re running any paid advertising like Facebook ads. In that case, you want to be checking your stats regularly so you can make tweaks as necessary to optimize your campaigns.
Oonce the launch is over and your cart is closed–that’s when you have a second to breath and to see what worked really well, and what might have flopped (just a bit).
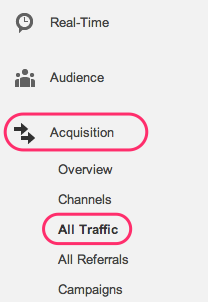
First, head over to Google Analytics and click on Acquisition and then All Traffic:
Then, click on the dropdown menu next to Conversions and select which goal you want to see.
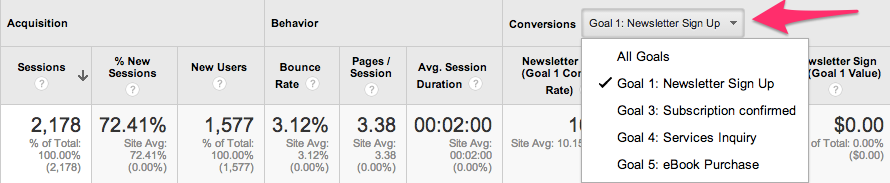
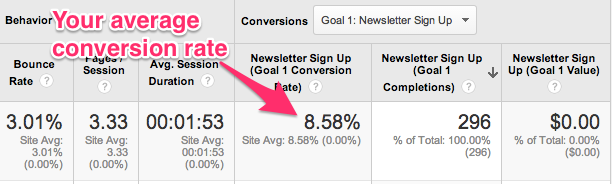
Let’s say you want to see where the majority of your purchases came from. Choose the Purchase goal you’ve already set up, and then click on the middle column under the Conversions section (see screenshot).
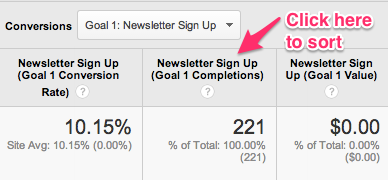
This will sort the data so that you can see the source of the majority of your conversions. That way you’ll know which traffic sources (like social media, guest posts, your emails, etc.) brought in the most purchases:

Another piece of data that’s worth looking at is the conversion rate for each of those sources.
I can see in my data table above that I get higher conversion rates from the guest posts I write versus casually posting links to my landing page on social media.
So that’s something I’ll keep in mind for my next launch: do more guest posting to build my list and don’t worry that much about social media.
A note about social media traffic: if you’re advertising on either Facebook (check out this Facebook Ads podcast) or Twitter, the traffic in Google Analytics will look like it’s coming from your normal social media channels. But that’s not completely accurate.
That’s why it’s so important to implement conversion tracking – so you don’t have to guess how much of your revenue is a direct result of your advertising investment.
Add it to your post-mortem
Your postmortem (or launch review) is a complete look at your launch once it’s all said and done.
You review both the hard data and the things you learned about yourself and your business.
I like to do postmortems in a plain Google Doc – all you need are the key takeaways displayed in a format that will make sense to you when you look at it again in the future.
Before you launch again, you’re going to want this doc handy.
So what numbers should go in your postmortem?
1.Overall conversion rate. This is the percentage of people who saw your sales page who also purchased your product. Average conversion rates tend to fall between 1% and 3% – if yours is lower, think about working on the copy on your sales page.
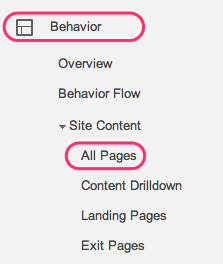
 2. Number of visits to your sales page. You can find this under Behavior > Site Content > All Pages, and make sure you set the date for your launch period only.
3. Numbers of purchases, and a breakdown of how many of which product sold if you were offering more than one product.
And that’s it!
You don’t need to be a spreadsheet whiz to make sense of really valuable data.
Your postmortem doesn’t need to have a ton of data points for it to be useful.
The point here is to get exactly what you need from Google Analytics, learn from it, and move on to your next big project while keeping all this good stuff in mind.
What am I missing?
Everyone tracks their results a little differently.
When this was one of my primary tasks working with a team, we disagreed on the regular about what was really valuable because we all had different goals in mind.
So what do you pay attention to before, during and after your launch? What are the top metrics for your business?
Let us all know in the comments below – maybe I need to add an extra bullet point or two to my next postmortem!
 Claire Pelletreau is a Facebook ads consultant and confessed conversion junkie. She’s been playing with Facebook ads since 2011 and sharpened her skills running paid campaigns for Laura Roeder’s five and six-figure launches. Now she applies everything she learned to help other small businesses bring in more subscribers and sales than they ever imagined.
Get more bang for your advertising buck – click here to learn more about Facebook ads from Claire!
One Response to The Guide to Painlessly Tracking Your Results with Google Analytics
Comments are closed.